01
Returns and risk
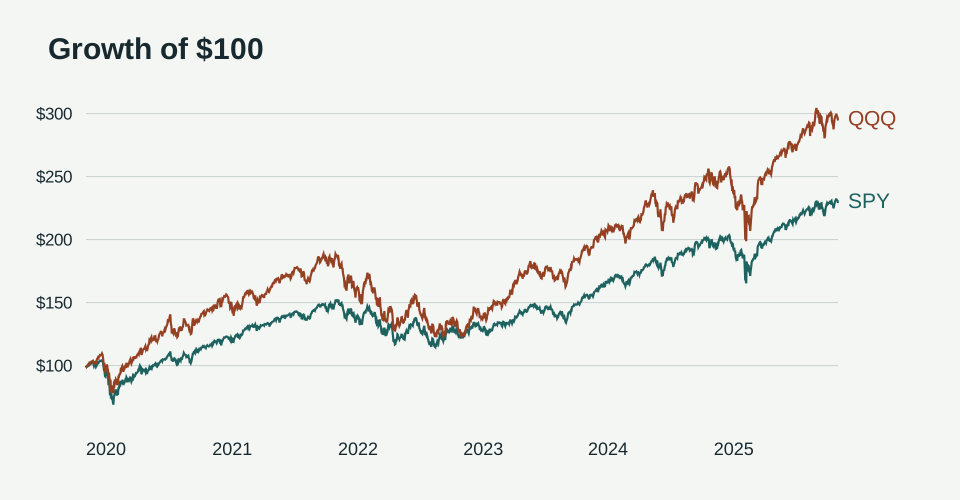
| Metric | SPY | QQQ |
|---|---|---|
| Cumulative return | +129.06% | +194.52% |
| Maximum drawdown | −33.72% | −35.12% |
| Drawdown trough | Mar 23, 2020 | Nov 3, 2022 |
| Annualized volatility, final 21 sessions | 8.72% | 13.21% |
Daily returns had a correlation of 0.9365 across the sample. The funds often moved together, but their deepest losses came at different times. SPY reached its drawdown trough in March 2020 and QQQ in November 2022.
02
Calculations
The script calculates daily percentage changes and tracks each fund’s decline from its highest adjusted close to date. A trailing window of 21 daily returns gives the rolling compounded return, sample volatility annualized using 252 trading sessions, and Pearson correlation between funds.
03
Run the analysis
Extract the ZIP and run python analyze.py with Python 3.10 or later. The archive includes the script, adjusted prices, daily metrics, and instructions for changing the rolling window.